19 Feb

January Canadian Home Sales Improve

General

Posted by: John Dunford

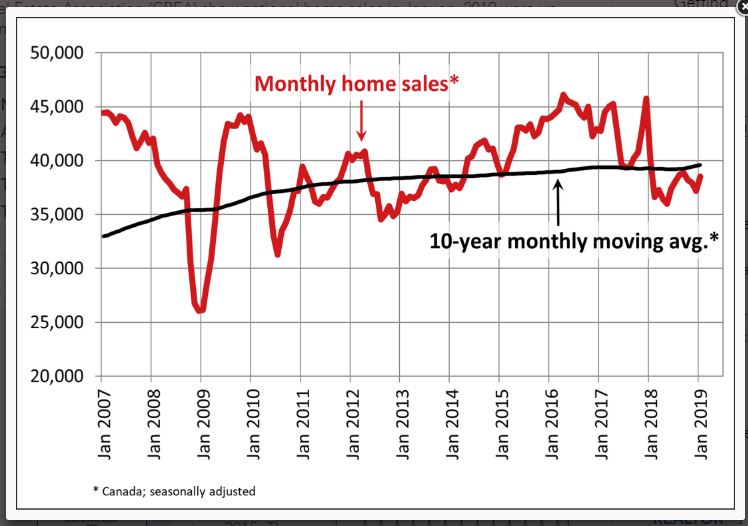
Statistics released today by the Canadian Real Estate Association (CREA) show that national home sales improved in January, climbing 3.6% from December ’18 to January ’19. Last year’s annual sales were the weakest since 2012.

As the chart below shows, national monthly home sales remain below their 10-year moving average and are decidedly lower than in the boom years of 2016 and 2017. Households are still adjusting to the tightened mortgage qualification rules introduced in January 2018. The number of homes trading hands was up from the previous month in half of all local markets, led by Montreal, Ottawa and Winnipeg.

Actual (not seasonally adjusted) sales were down 4% from year-ago levels and posted the weakest January since 2015. Year-over-year (y/y) sales were below the 10-year average for January on a national basis and in British Columbia, Alberta, Saskatchewan, Ontario and Newfoundland & Labrador.

Housing market conditions remain weakest in the Prairie region, and the Lower Mainland of B.C. Housing has been more fragile than the Bank of Canada expected, notwithstanding the tighter mortgage regulations combined with previous actions by provincial governments and CMHC to slow housing activity. The slowdown in housing has contributed meaningfully to the weakness in Canadian economic activity.

New Listings

The number of newly listed homes edged up 1% in January, led by a jump in new supply in Greater Vancouver and Hamilton-Burlington.

With sales up by more than new listings, the national sales-to-new listings ratio tightened to 56.7% compared to 55.3% posted in December. This measure of market balance has remained close to its long-term average of 53.5% for the last year.

Based on a comparison of the sales-to-new listings ratio with the long-term average, more than half of all local markets were in balanced market territory in January 2019.

There were 5.3 months of inventory on a national basis at the end of January 2019, in line with its long-term average. That said, the well-balanced national reading masks significant regional differences. The number of months of inventory has swollen far above its long-term average in Prairie provinces and Newfoundland & Labrador; as a result, homebuyers there have an ample choice of listings available for purchase. By contrast, the measure remains well below its long-term average in Ontario and Prince Edward Island, consistent with seller’s market conditions. In other provinces, sales and inventory are more balanced.

Home Prices
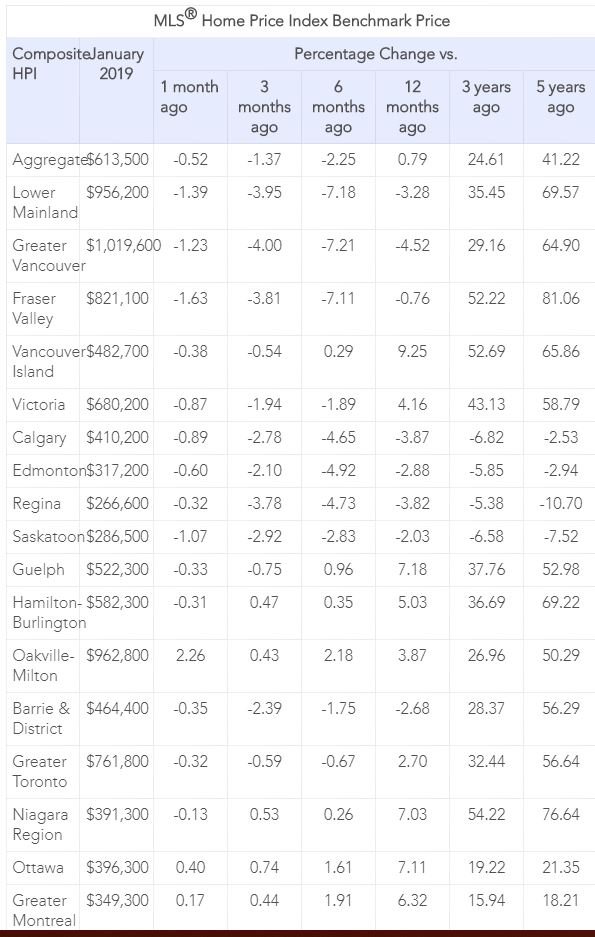
The Aggregate Composite MLS® Home Price Index (MLS® HPI) was up 0.8% y/y in January 2019 – the smallest increase since June 2018.

Following a well-established pattern, condo apartment units recorded the largest y/y price increase in January (+3.3%), followed by townhouse/row units (+1.5%). By comparison, two-storey single-family home prices were little changed (+0.1%) while one-storey single-family home prices edged down (-1.1%).

Trends continue to vary widely among the 17 housing markets tracked by the MLS® HPI. Results were mixed in British Columbia. Prices were down on a y/y basis in Greater Vancouver (-4.5%) and the Fraser Valley (-0.8%). By contrast, prices posted a y/y increase of 4.2% in Victoria and were up 9.3% elsewhere on Vancouver Island.

Among housing markets tracked by the index in the Greater Golden Horseshoe region, MLS® HPI benchmark home prices were up from year-ago levels in Guelph (+6.8%), the Niagara Region (+6.8%), Hamilton-Burlington (+6.4%), Oakville-Milton (+3.3%) and the GTA (+3%). Home prices in Barrie and District remain slightly below year-ago levels (-1.1%).

Among Greater Golden Horseshoe housing markets tracked by the index, MLS® HPI benchmark home prices were up from year-ago levels in Guelph (+7.2%), the Niagara Region (+7%), Hamilton-Burlington (+5%), Oakville-Milton (+3.9%) and the GTA (+2.7%). By contrast, home prices in Barrie and District remain below year-ago levels (-2.7%).

Across the Prairies, supply is historically elevated relative to sales, causing benchmark home prices to remain down from year-ago levels in Calgary (-3.9%), Edmonton (-2.9%), Regina (-3.8%) and Saskatoon (-2%). The home pricing environment will likely remain weak in these cities until elevated supply is reduced.

Home prices rose 7.1% y/y in Ottawa (led by a 9.5% increase in townhouse/row unit prices), 6.3% in Greater Montreal (led by a 9.2% increase in townhouse/row unit prices) and 1% in Greater Moncton (led by a 15.1% increase in townhouse/row unit prices). (see Table 1 below).

Bottom Line

The Bank of Canada meets again on March 6th and it is highly unlikely they will hike interest rates. The Canadian economy has been burdened with a weakened oil sector, reduced trade and a weak housing market. Although job growth has been stronger than expected, wage gains have moderated and inflation pressures are muted.

We are likely in store for a prolonged period of modest housing gains in the Greater Golden Horseshoe, stability or softening in much of British Columbia and further weakening in the Prairies, Alberta, and Newfoundland & Labrador.

Sluggish sales and modestly rising prices nationally are likely in prospect for 2019. While there will still be some significant regional divergences, there is no need for further policy actions to affect demand. Indeed, a growing chorus has been calling for lowering the mortgage qualification rate from the posted five-year fixed rate, currently 5.34%, to closer to the actual conventional rate, about 200 basis points lower.

13 Feb

Choosing The Big 6 Means Mortgage Customers Are Overpaying

General

Posted by: John Dunford

The Big 6 banks dominate the Canadian mortgage market but may not be the best choice for borrowers.

An analysis from LowestRates.ca has found that, in 2018, Canada’s largest banks – RBC, TD, BMO, Scotiabank, CIBC, and National Bank of Canada – were consistently the most expensive options.

Even the lowest rates of the Big 6 were always costlier than the lowest rates from smaller lenders, the study found.

“The big banks never offer the lowest posted rates on the market, but Canadians aren’t spending enough time researching rates before signing their mortgages, and that’s potentially costing them thousands of dollars a year,” said Justin Thouin, CEO and Co-Founder of LowestRates.ca.

He added that Canadians are used to shopping around for the best prices on items such as TVs or vacations but often fail to realise that the same strategy could mean big savings on their mortgage.

How much could borrowers save?

As a typical example, LowestRates.ca found that when RBC lowered its 5-year rate to 3.74%, consumers on that rate would pay $2,560 per month on a $500,000 mortgage (assuming a down payment of at least 20% per cent to avoid CMHC insurance, and a 25-year amortization period).

But the best available rate on LowestRates.ca was 3.23%, saving borrowers $134 per month (with a payment of $2,426) – or a staggering $40,200 over the lifetime of the loan.

“Brokers and smaller lenders often drop their rates first to be more competitive, and banks are slower to implement changes because they know they own the market,” Thouin said. “This will only change when Canadians realize they’re being overcharged and begin to shift away from the banks, and that will only happen as we increase awareness about the alternative market. The best deals are found online, not in your family’s legacy bank branch.”

10 Feb

Canadian jobs surge in January as jobless rate rises to 5.8%

General

Posted by: John Dunford

Housing News

January Data From Local Real Estate Boards

In separate releases, the local real estate boards in Canada’s largest housing markets released data this week showing home sales fell sharply in Vancouver, edged upward in Toronto and continued robust in Montreal. Overall, higher interest rates, the mortgage stress test and in the case of Vancouver, measures adopted a year ago by the BC and municipal governments still keep many buyers on the sidelines.

In Vancouver, home sales are in a deep slump, declining 39% year/year in January, though they were up 3% month/month. Sales in January were the weakest for that month since 2009–the depth of the financial crisis. Hardest hurt were sales of luxury properties.

The Vancouver benchmark price fell 4.5%, which was the most significant decline since the recession. The area’s composite benchmark price now has decreased by 7.7% since the cyclical peak in June 2018.

The number of listings rose sharply from a year earlier as sellers rushed to market fearing further price declines. In Vancouver, supply-demand conditions now favour buyers.
Toronto home sales edged higher in January, rising 0.6% year/year. Sales were up 3.4% compared to December 2018. The benchmark price rose 2.7% compared to January 2018. The condo apartment market segment continues to lead the price gains. Toronto area supply-demand conditions remain balanced.

Montreal saw a 15% year/year increase in sales last month. Demand remains robust as the number of active listings fell sharply. Benchmark prices of single-family homes increased 3% year/year, while condos prices rose 2%.

Montreal is now a highly desirable sellers’ market, which is especially true in the single-family home segment in direct contrast to the underperformance of that sector in the GVA and the GTA over the past year.

CMHC Says Overvaluation Decreasing But Housing Still ‘Vulnerable’

The Canada Mortgage and Housing Corporation (CMHC) said this week that the country’s overall real estate market remains ‘vulnerable’ despite an easing in overvaluation in cities like Toronto and Victoria in the third quarter of 2018. CMHC is using old data, as we already have numbers through yearend 2018 and preliminary data for January, all showing that overheating in Toronto and Vancouver has dissipated.

Many Calling for Mortgage Stress Test Review

Local real estate boards, mortgage professionals’ trade groups and some economists are calling for some relief on the stringency of the federal regulator’s mortgage stress test. According to Phil Moore, president of the Real Estate Board of Greater Vancouver, “Today’s market conditions are largely the result of the mortgage stress test that the federal government imposed at the beginning of last year. This measure, coupled with an increase in mortgage rates, took away as much as 25% of purchasing power from many homebuyers trying to enter the market.”

Economists at CIBC and BMO this week highlighted that the tightened qualification requirements for mortgage applicants had slowed activity measurably. While raising the qualification rate by 200 basis points might have made sense eighteen months ago, when housing markets were red hot in Vancouver and Toronto and interest rates were at record lows, we are in a very different place in the economic cycle today.

The Bank of Canada has raised the overnight benchmark policy rate by 75 basis points since the introduction of the new measures, which begs the question of whether 200 basis points is still the right number.

The Office of the Superintendent of Financial Institutions (OSFI) introduced the B20 rules in January 2018 aiming to thwart a credit bubble amid inflated household debt burdens and frothy housing markets. The new rules force people who want a new uninsured mortgage to demonstrate they can manage payments at rates two percentage points above what’s being offered by a lender. The new rules have been very effective in cooling household borrowing and reversing the gains in overheated housing markets.

Indeed, mortgage growth has shrunk to a 17-year low in Canada. Residential mortgage growth was posted at 3.1% in December from a year earlier, the slowest pace since May 2001, and half the growth rate of two years ago.

The slowdown in housing has had a material effect on the economy as a whole. Weakened economic growth has moved the Bank of Canada to the sidelines. While the Bank is now more cautious in jacking up the policy rate to a neutral level, the residential mortgage market is now–in a stress-test perspective–well into restrictive territory. For example, the Bank’s policy rate is at 1.75% (well below the 2.5% rate the BoC considers neutral), while posted mortgage rate used for stress testing is at 5.34%.

This week, OSFI defended the B20 rule suggesting that “The stress test is, quite simply, a safety buffer that ensures a borrower doesn’t stretch their borrowing capacity to its maximum, leaving no room to absorb unforeseen events.”

Canadian Job Market Surges in January

Statistics Canada released its January Labour Force Survey this morning showing employment increases of 66,800 versus expectation of merely a 5,000 job gain. The surge was led by record private-sector hiring and service sector jobs for youth. This is good news for an economy facing considerable headwinds in the oil sector, weakening housing activity, volatile financial markets and falling consumer confidence. If sustained, the strong employment data will ease some concerns about the length and depth of the current soft patch.

Even with the strength in job creation, the unemployment rate jumped 0.2 percentage points to 5.8% as more people looked for work–a sign of strength. This suggests there is more capacity in the economy before inflation pressures begin to mount–a big point for the Bank of Canada. Economic growth is now hovering around 1%, but the Bank of Canada expects it to recover to about a 2% pace in the second half of this year. The central bank will remain on the sidelines until it can verify that a rebound is occurring.

Wage gains remained depressed, a key indicator for the Bank. Average hourly wages were up 2% from a year ago, with pay for permanent employees up 1.8%.

Alberta, which has been flattened by slumping oil prices and production cuts, posted a second consecutive monthly decline in employment. Ontario led the job surge followed by Quebec.

Provincial Unemployment Rates
(% 2019, In Ascending Order)

Province                                                  Jan        Dec
British Columbia                                   4.7         4.4
Quebec                                                    5.4         5.5
Saskatchewan                                        5.5         5.6
Manitoba                                                5.5         6.0
Ontario                                                    5.7         5.4
Alberta                                                    6.8         6.4
Nova Scotia                                            6.9         7.0
New Brunswick                                     8.2         8.4
Prince Edward Island                          9.9         9.6
Newfoundland and Labrador          11.4        11.7

6 Feb

Mortgage Rules Are The Prudent Approach To Underwriting Says OSFI

General

Posted by: John Dunford

The tighter mortgage rules introduced at the start of 2018 have been defended by the financial services regulator.

The B-20 mortgage guidelines continue to be cited by Realtors for falling home sales and there have been countless calls for them to be changed or scrapped.

But the assistant superintendent of OSFI spoke Tuesday to defend the methods the regulator is using to ensure stability of the Canadian financial system.

In a speech to the Economic Club of Canada in Toronto, Carolyn Rogers acknowledged the huge number of articles and commentaries there have been over the past year – and noting that B-20 even has its own social media hashtag.

But she said that all the OSFI rules go through a public consultation and all receive feedback which is listened to.

Stress test criticism

Ms. Rogers spoke specifically about the element of B-20 which has received the most attention – and continues to weaken home sales and challenge those who want to be homebuyers.

“The stress test is, quite simply, a safety buffer that ensures a borrower doesn’t stretch their borrowing capacity to its maximum, leaving no room to absorb unforeseen events. This is simply prudent. It’s prudent for the bank and it’s prudent for the borrower too,” she said.

She acknowledged that OSFI has received criticism of the stress test but said there had been positive feedback too.

Addressing those who say the stress test is a national policy to deal with a localized problem, she says that it is wrong to say that the policy was designed to lower home prices.

“B-20 was designed to target mortgage underwriting standards. And sound underwritings look the same no matter what city or province you live in,” she stated.

The deputy superintendent also pointed out that the stress test is not just designed as a buffer to rising interest rates – responding to those who say now rates are higher the buffer should be reduced.

“Borrowers face other risks that can impact their ability to pay their mortgage that I mentioned earlier: changes to income or changes to expenses other than their mortgage. It’s prudent to have a buffer for these changes as well,” Ms Rogers said.

OSFI continues to monitor the situation in consultation with the BoC she added.

Unregulated lenders

Responding to the view that tighter lending standards for regulated mortgage lenders is driving consumers to unregulated lenders, Ms. Rogers accepted that this is a risk.

But she urged mortgage brokers and real estate agents to mitigate this by guiding vulnerable homebuyers including first-time buyers in the right direction.

“The mortgage broker and the real estate industry are well placed to help manage this risk. If you see risks, if you think these options put your borrower in a vulnerable position, you can steer them away. That would be the right thing to do,” she said.

Renewals exemption

The exemption for borrowers who renew with their existing lender but would not pass the stress test has been criticized as dampening competition, as the exemption does not pass to the new lender.

The deputy superintendent said that changing this could displace borrowers who are meeting obligations to their current lender and could see borrowers becoming the focus of price competition.

Whether this lack of portability means those renewing receive less favourable rates by existing lenders has not been shown by OSFI’s monitoring.

More debt is not the answer to home affordbality

Ms. Rogers concluded by saying that the answer to rising home affordability issues is not greater debt fuelled by lower underwriting standards.

While noting that the issues of housing costs were a problem that is proving highly challenging, she defended OSFI’s policies and the criticism of ‘unintended consequences’ and highlighted that weaker lending standards have been shown to do more harm to financial stability than the benefits they were intended to create.